
Since the end of September 2021 we have been asking workers about their most costly expense (other than rent) each week. We have also been asking them who made the decision to spend the money and how they spent the money (in cash or digitally). In this blog we marry these data with a segmentation analysis we conducted in October to understand the varying roles of women garment workers within their households. The segmentation analysis focused on women for whom we had sufficient data to feel confident in their assignment to a particular segment based on the pattern of their behavior over time, meaning that this blog draws on a sub-sample of 703 women.


Note: Banner photo courtesy of a garment worker in Bangladesh; numbers in graphs may not sum to 100% due to rounding.
Spending Patterns
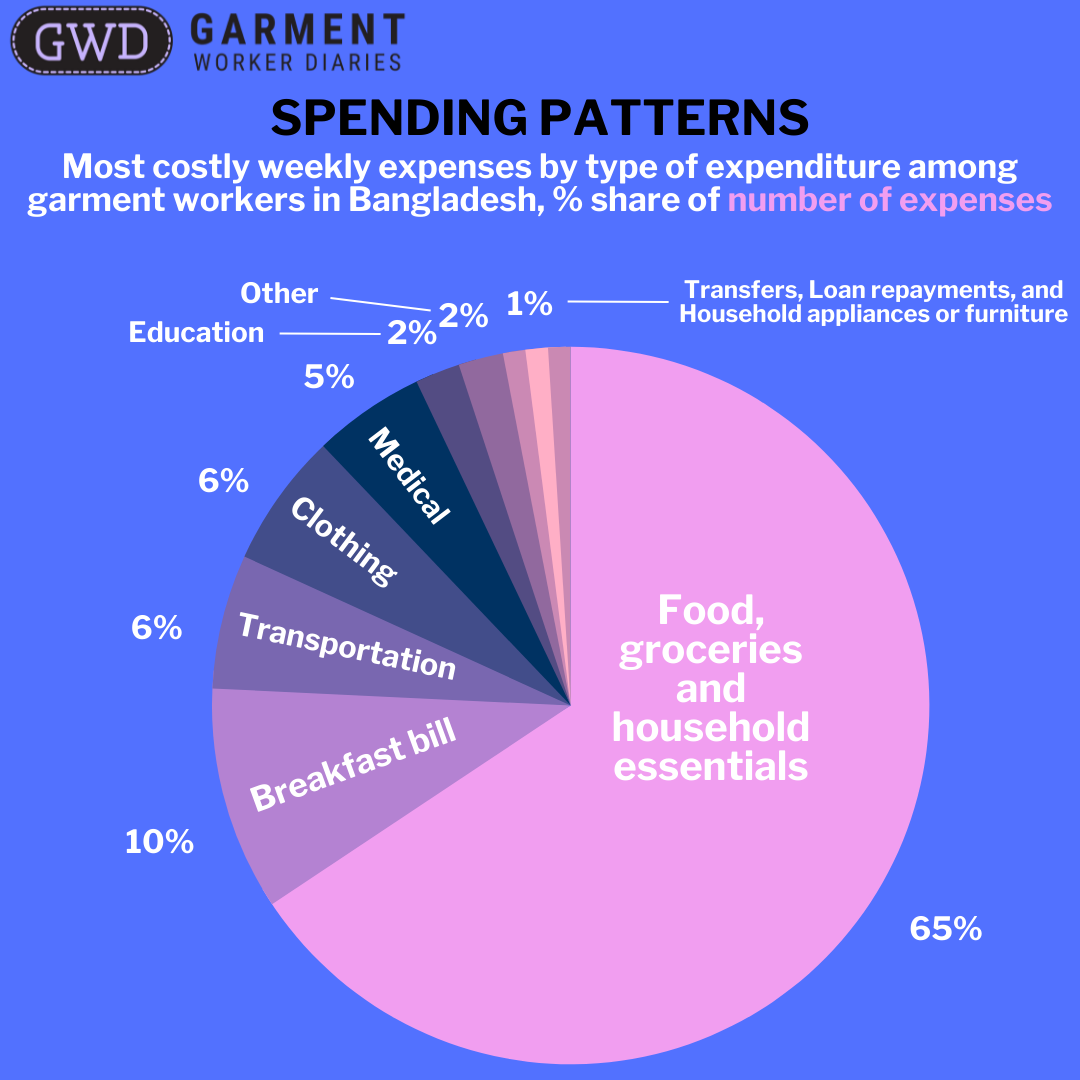
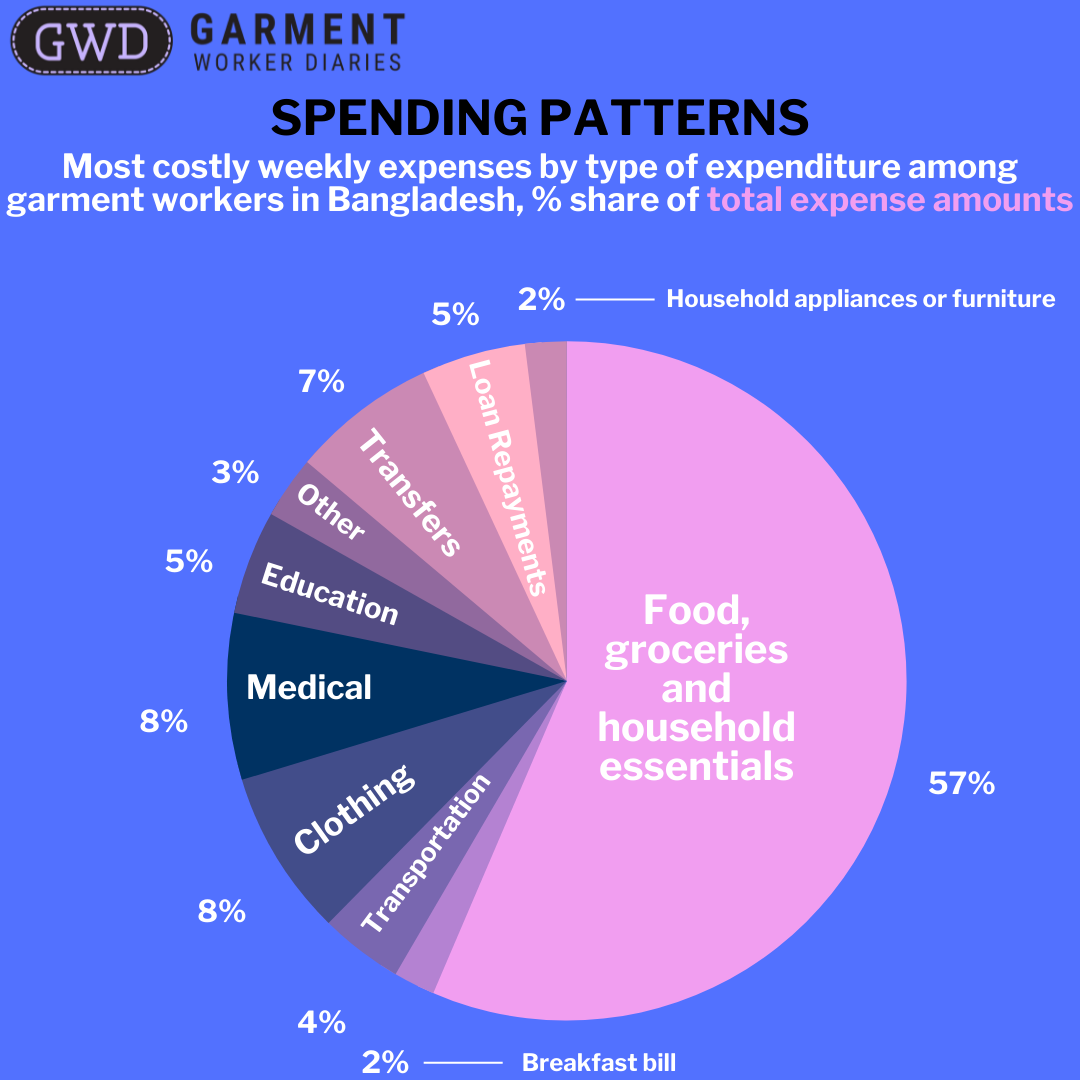
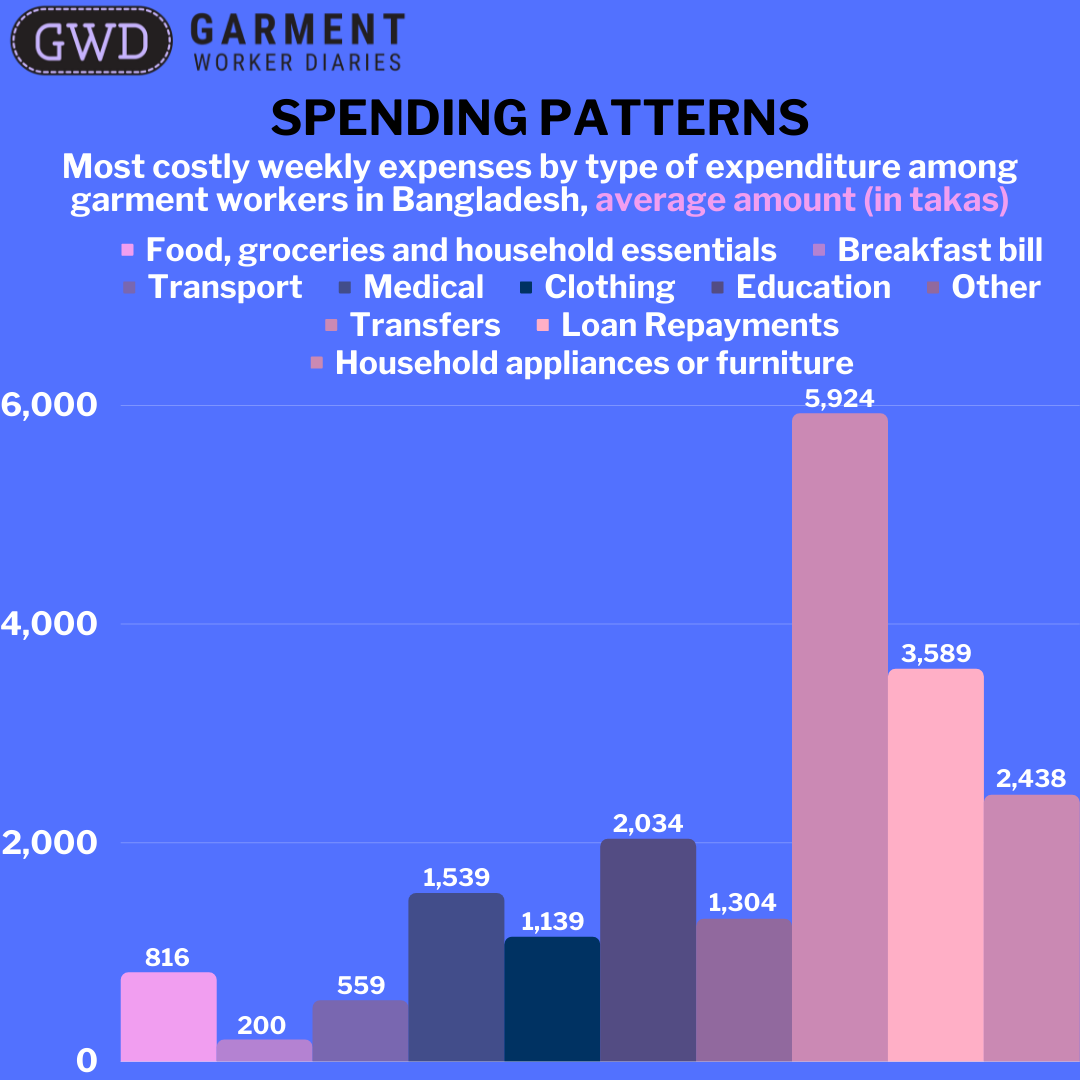
We have over 9,600 responses to the question related to spending from 703 women in our sub-sample for the period from October to December 2021. In one quarter of those responses the women reported that they had no expenditures that week. Of the remaining 75% of responses, the most common response was that some type of food, grocery, or household essentials expenditure was their most costly expense—65% of all responses accounting for 57% of the amount they reported spending on their most costly expenses. The second most common costly expense was payment of what the workers call their “breakfast bill,” which is primarily a payment to street vendors for a prepared breakfast they buy in the mornings before work, but can also include other prepared foods purchased from street vendors. But this item only constituted 2% of the amount they spent on their costly expenses, with the average breakfast bill amounting to only Tk. 200 in a week. The other responses covered a wide variety of different expenditures including transportation, medical expenses including medicines, clothing, education, transfers, loan repayments, and household appliances of furniture. Excluding the breakfast bill, the average amount spent per transaction ranged from Tk. 559 for transportation-related expenditures to Tk. 5,924 for transfers to other people.
|
Type of Expense |
% share of number of expenses | % share of total expense amounts | Average amount in takas |
| Food, groceries and household essentials | 65% | 57% | 816 |
| Breakfast bill | 10% | 2% | 200 |
| Transportation | 6% | 4% | 559 |
| Medical | 5% | 8% | 1539 |
| Clothing | 6% | 8% | 1139 |
| Education | 2% | 5% | 2034 |
| Transfers | 1% | 7% | 5924 |
| Loan Repayment | 1% | 5% | 3589 |
| Household appliance or furniture | 1% | 2% | 2438 |
| Other | 2% | 3% |
1304 |
Spending Decisions
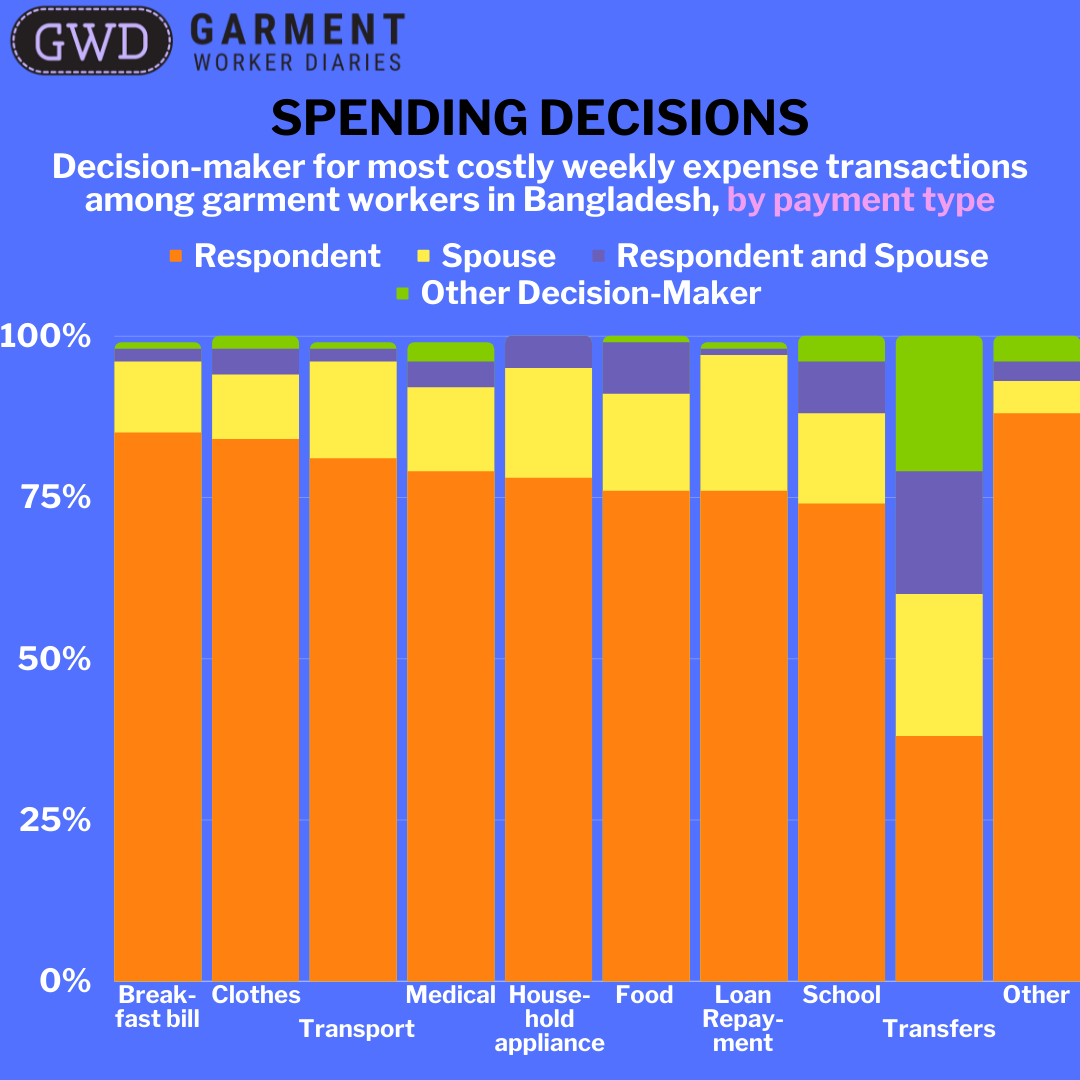
We asked workers who made the decision to spend the money on these expenses. In 78% of the cases, the women workers responded that they made the decision on their own, and in another 7% of cases they had made the decision with their spouse. In 14% of cases, the husband made the decision.
| Decision-Maker | % share of costly purchase decisions made |
| Respondent | 78% |
| Spouse | 14% |
| Respondent and Spouse | 7% |
| Other | 1% |
With one exception, there was little variation in who was involved in a spending decision across different spending categories. In most cases the respondent reported making the decision on their own—as often as 85% of the time in the case of a breakfast bill payment to 74% in the case of an education expenditure. The one transaction category where the respondents reported having the least independent say was the category related to money transfers. In these cases, only 38% of the time did respondents report that they made the decision to make a transfer on their own. In 22% of the cases the respondent’s husband made the decision for her, and in 19% of the cases the respondent and her husband made the decision jointly. In many of these cases where the husband was involved, the recipient of the transfer was the husband himself. Finally, in 21% of the cases either someone other than the respondent or her husband was involved in the decision. These data suggest that there is a strong “pull” element to transfers, where the sender is not the one in control of the decision as to whether to transfer the money or not.
| Type of Expense | Decision-Maker | |||
| Respondent | Spouse | Respondent and Spouse | Other | |
| Breakfast bill | 85% | 11% | 2% | 1% |
| Clothing | 84% | 10% | 4% | 2% |
| Transportation | 81% | 15% | 2% | 1% |
| Medical | 79% | 13% | 4% | 3% |
| Household appliance or furniture | 78% | 17% | 5% | 0% |
| Food, groceries and household essentials | 76% | 15% | 8% | 1% |
| Loan Repayment | 76% | 21% | 1% | 1% |
| Education | 74% | 14% | 8% | 4% |
| Transfers | 38% | 22% | 19% | 21% |
| Other | 88% | 5% | 3% | 4% |
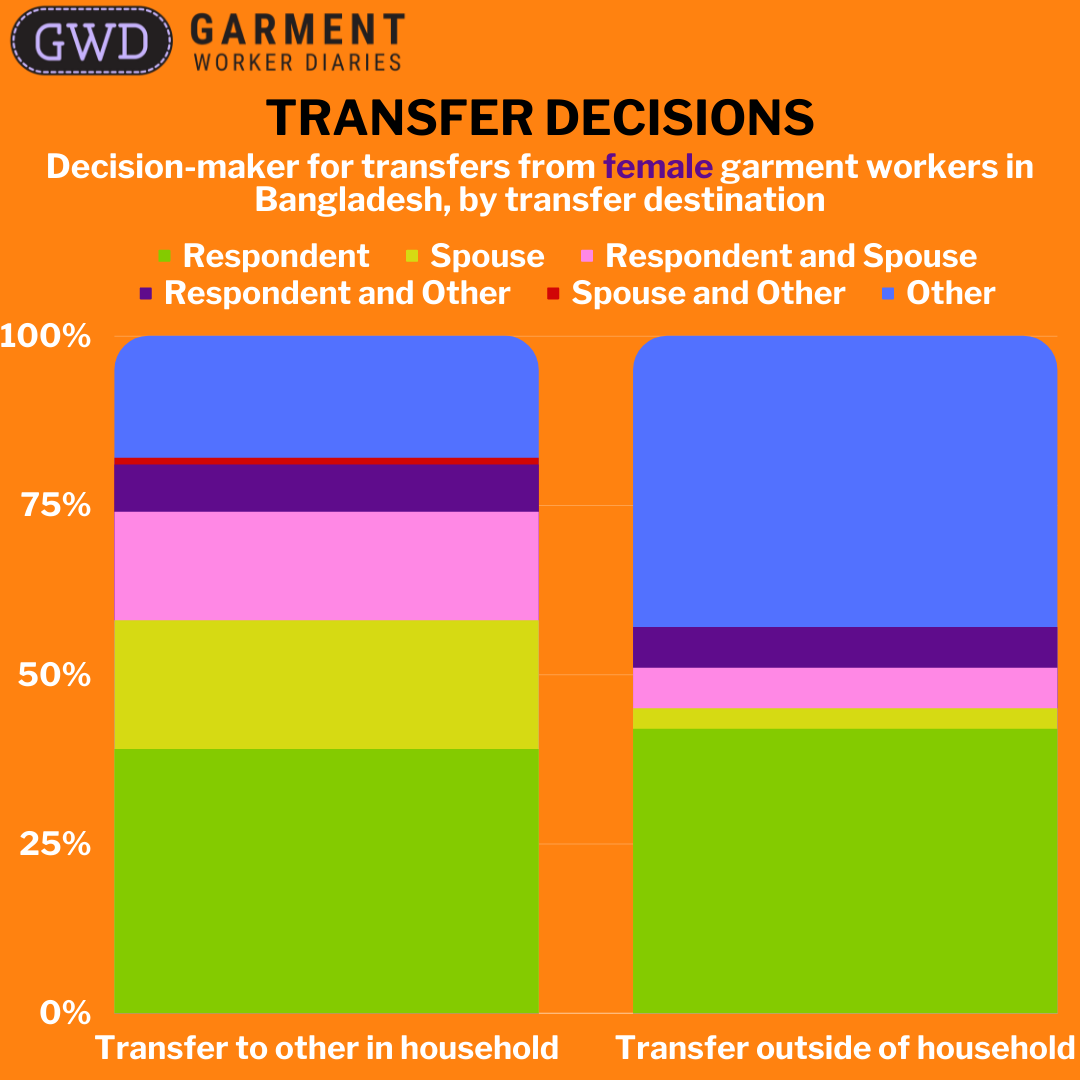
This is borne out by the more general information we collect about transfers each week, which is part of our core survey. We ask workers to tell us about the transfers they have made in the past week, both to and from others in their household and to and from others outside their household. We also ask them who made the decision to initiate the transfer. The share of respondents reporting they made the decision to initiate a transfer to someone else either inside or outside the household is very similar to the answers we reported earlier. Where they differ is in the distribution of answers across other people initiating the decision, and this is due to the very different social dynamics within a household compared to those with others outside the household. Within-household transfers were highly likely to involve the worker’s husband, who either initiated the transfer on his own or in consultation with his wife. For transfers outside the household, others, such as parents or siblings, were far more involved in the decision.
| Person making decision (women) | Transfer to other in household | Transfer to outside of household |
| Respondent | 39% | 42% |
| Spouse | 19% | 3% |
| Respondent and Spouse | 16% | 6% |
| Respondent and other | 7% | 6% |
| Spouse and other | 1% | 0% |
| Other | 18% | 43% |
To conclude, what the spending pattern data reveal is that the bulk (75%) of female garment workers’ largest expenses in any given week (aside from rent) involve buying food or other household products, and that a majority share (almost 60%) of that total money spent goes to food and household products. When we add in the percentage share of total expense amounts that go to transfers (another 7%), we see that a full two-thirds of female garment workers’ expenditures either leave their hands or are spent on what are almost certainly disposable commodities.
The spending decisions data reveal two more important takeaways, and perhaps a surprise: for almost all types of costly purchases, female garment workers are largely autonomous in deciding what they will buy, and in situations when they don’t have complete autonomy this is partially made up for by the fact that they are deciding along with their spouse; however, this patterns breaks down when we look at transfers, as female garment workers are much less in complete control when deciding to whom they should send money.
The surprise here is that the “pull” factor of transfers is not unique to women, and in fact acts even more strongly on men. In the table below, we can see that in general men give up even more of their autonomy in money transfer decision-making than women. These data suggest that the holistic decision-making phenomenon involved in money transfers is not gender specific, but perhaps instead a value intrinsic to how transfers are utilized and regarded by garment workers in Bangladesh.
| Person making decision (men) | Transfer to other in household | Transfer to outside of household |
| Respondent | 31.5% | 36% |
| Spouse | 21.5% | 5% |
| Respondent and Spouse | 17.5% | 4% |
| Respondent and other | 5% | 10% |
| Spouse and other | 1% | 1% |
| Other | 23.5% | 44% |
Next week we will return to spending patterns and decision-making, but we will look at the data from the perspective of three groups of workers whose transfer activity and rent payment patterns cluster together: Supporters, Independents, and Money Managers.
The data used for the analysis presented here come from interviews conducted over the phone throughout 2020 and 2021 with a sub-sample of 703 women workers, and a sub-sample of 235 male workers. These workers are employed in factories spread across the five main industrial areas of Bangladesh (Chittagong, Dhaka City, Gazipur, Narayanganj, and Savar).