In last week’s GWD blog we looked at the most costly expenses garment workers incur from week to week, and we used those data to help determine who is deciding to make these costly purchases. Our conclusion was that for almost all types of costly expenses almost all garment workers (both women and men) decide for themselves what to purchase. The one exception we found to this pattern was in the case of money transfers sent to people living inside or outside of the household. In the case of money transfers, garment workers themselves leave much of the decision-making up to other people.
As we promised last week, we will now take those transfer data, add in some data on rent payment patterns, and emerge with three behavioral segments. We can assign garment workers in our study to one of these groups, and see how each group behaves in regards to household roles, spending and decision-making.

Note: Banner photo courtesy of a garment worker in Bangladesh; numbers in graphs may not sum to 100% due to rounding.
Behavioral Segments
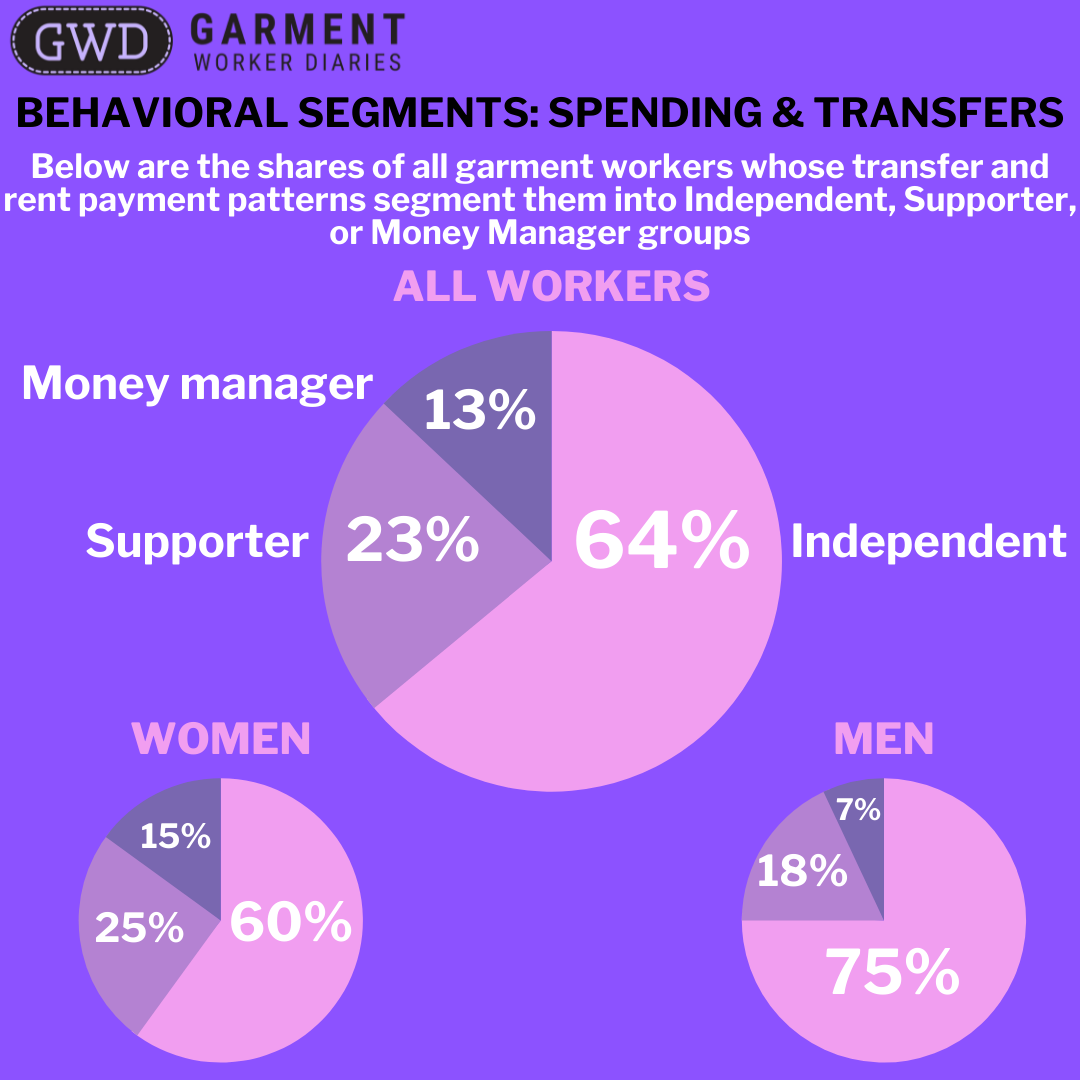
In October 2021 we conducted a cluster analysis of the behavior of workers for whom we had at least five months of data for the period from May 2020 to August 2021—in other words up to the point when we started asking questions about spending decisions. The analysis clustered, or segmented, the workers in the sample according to the extent to which they gave or received transfers from other members of their household and paid rent, as a share of their total income for the month from their work in a garment factory. We were able to identify six segments that show distinctive behaviors along these dimensions. We collapsed those six segments into three broad groups: Supporters, Independents, and Money Managers. These segments can be found both among men and women. Supporters are workers who hand over a large share of their salary, about half, to someone else in their household, most commonly their spouse: they make up 25% of the women in our sample and 18% of the men. Independents give and receive transfers from other members of their households but in small amounts relative to their average monthly salary. They constitute 60% of women and 75% of men. Within this segment are two sub-segments who are differentiated by the extent to which they pay rent or not. Finally, Money Managers are workers who not only earn a salary but receive money from other members of the household. Money Managers are also highly likely to pay rent. They make up 15% of women in our sample and 7% of the men.
| Behavioral Segment | % Share of Sample |
| Independent | 64% |
| Money Manager | 13% |
| Supporter | 23% |
We checked to see if the segmentation held true when we added more data for the period from September 2021 and December 2021. The results suggest that the segments are fairly stable.
The first table below shows the share of workers’ factory income that goes to IHTs based on the original data up to August 2021, and the second tables then shows data up to Dec 2021.
| Behavioral Segment | Avg. Iht In Amount Mean | Avg. Iht Out Amount Mean |
| Independent | 5% | 7% |
| Money Manager | 50% | 13% |
| Supporter | 12% | 63% |
| Behavioral Segment | Avg. IHT In, Data to Dec. 2021 | Avg. IHT Out, Data to Dec. 2021 |
| Independent | 5% | 6% |
| Money Manager | 44% | 12% |
| Supporter | 10% | 57% |
Behavioral Segments and Spending Decisions
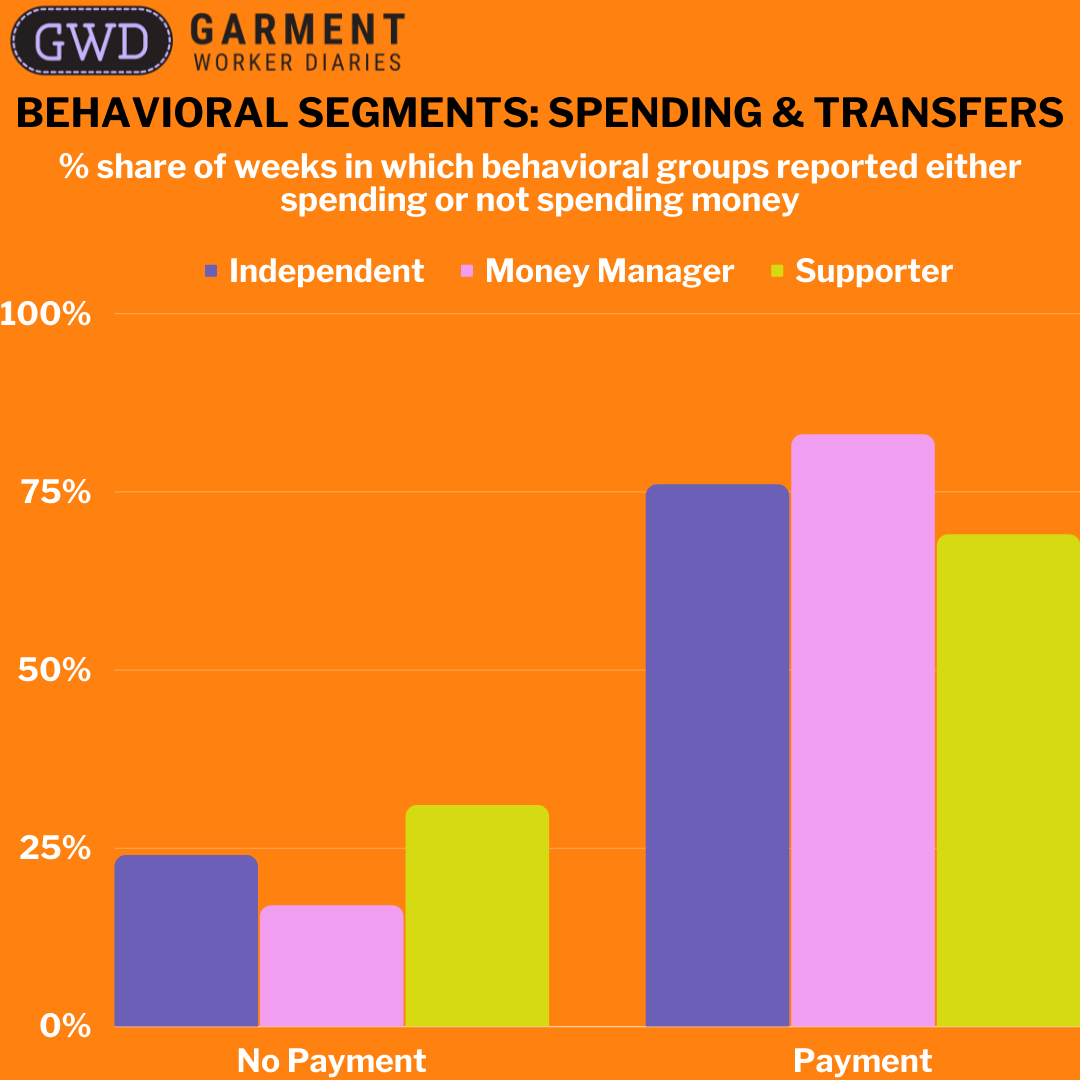
When we look at the spending decisions through the lens of behavioral segments, patterns emerge that confirm that women garment workers are not a homogenous group, but, rather, have distinct patterns of behavior and decision-making autonomy. First, let’s look at the basic spending patterns by behavioral segment. Money Managers are the least likely of the three segments to report not spending any money in a week (17%), followed by Independents (24%), and then Supporters (31%).
| Payment Status | Behavioral Segment | ||
| Independent | Money Manager | Supporter | |
| No Payment | 24% | 17% | 31% |
| Payment | 76% | 83% | 69% |
| Grand Total | 100% | 100% | 100% |
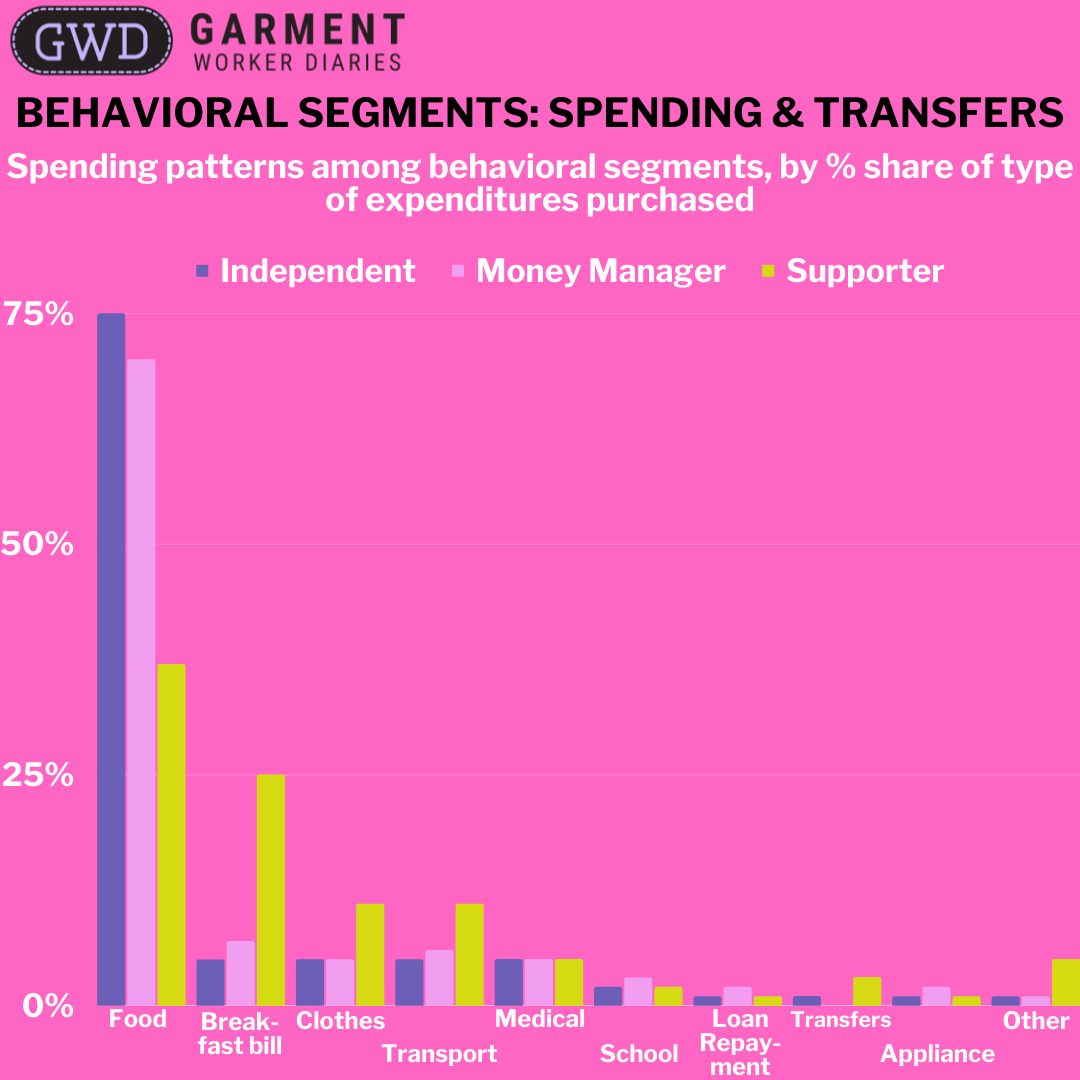
But, in weeks when they did spend money, Independents and Money Managers have roughly the same spending patterns, with a concentration of activity in food, groceries, and household essentials. Supporters’ behavior in weeks when they did spend money is very different. The share of spending on food, groceries, and household essentials is comparatively low, reflecting the fact that they are not in charge of the day-to-day spending in their household. As a result, other expenses, especially the breakfast bill, loom larger.
| Payment category | Behavioral Segment | ||
| Independent | Money Manager | Supporter | |
| Food, groceries, and household essentials | 75% | 70% | 37% |
| Breakfast bill | 5% | 7% | 25% |
| Clothing | 5% | 5% | 11% |
| Transportation | 5% | 6% | 11% |
| Medical | 5% | 5% | 5% |
| Education | 2% | 3% | 2% |
| Loan repayment | 1% | 2% | 1% |
| Transfer | 1% | 0% | 3% |
| Household appliance or furniture | 1% | 2% | 1% |
| Other | 1% | 1% | 5% |
In terms of the amounts involved Independents and Money Managers report similar amounts for their most costly expenditures. Supporters tend to report lower amounts, on average, except in the case of loan repayments and transfers.
| Payment category | Behavioral Segment | ||
| Independent | Money Manager | Supporter | |
| Breakfast bill | 212 | 215 | 191 |
| Clothing | 1,247 | 1,341 | 943 |
| Education | 2,121 | 2,260 | 1,391 |
| Food, groceries, and household essentials | 811 | 1,001 | 594 |
| Household appliance or furniture | 2,976 | 2,821 | 1,061 |
| Loan repayment | 3,899 | 2,655 | 3,664 |
| Medical | 1,884 | 1,493 | 708 |
| Transfer | 4,555 | 7,300 | 6,548 |
| Transportation | 689 | 693 | 362 |
| Other | 2,013 | 1,357 | 879 |
When it comes to who makes the decision about spending money, the data suggest that the respondents themselves, on their own, are the most likely to make the decision, regardless of behavioral segment. This is true, except in cases of educational spending and transfers. Supporters are far less likely to be involved in an educational spending decision than Independents and Money Managers—about half the time for the first compared to 90% of the time for the other two groups. Transfers show a more complicated situation, with Money Managers and Independents making more of the transfer decisions on their own, compared to Supporters. But, overall, respondents in all three groups are involved in the decision, one way or another, at about the same rate—60% of the time.
| Payment category | Behavioral Segment | Respondent | Respondent and spouse | Spouse | Respondent and other | Other |
| Education | Independent | 75% | 12% | 11% | 1% | 1% |
| Money Manager | 85% | 5% | 7% | 0% | 2% | |
| Supporter | 52% | 0% | 33% | 4% | 11% | |
| Transfer | Independent | 46% | 4% | 12% | 12% | 27% |
| Money Manager | 60% | 0% | 40% | 0% | 0% | |
| Supporter | 30% | 30% | 26% | 0% | 13% |
Fortunately, we have the full data on transfers from our core survey to dig deeper into the question of who decides to make transfers. These data allow us to differentiate between transfers within the household and outside the household. Independents and Money Managers have similar patterns of decision-making. Within their households they are involved in the transfer decision about 67% of the time, either because they make the decision on their own (about half the time) or make the decision with another person. But they are much less likely to be involved in decisions to make transfers to people outside of the household, where people other than the respondent or her husband, such as parents or siblings, dictate when a transfer is made. In the case of Supporters, the patterns are reversed. They are far less likely than women in the other groups to make a decision about a transfer within the household on their own—only 25% of the time. More generally, they are less likely to be involved in a within-household decision—58% of the time. But Supporters seem to have much greater autonomy than their counterparts in the other groups when it comes to transfers to people outside their household—they are the sole decision-maker 60% of the time.
| Person making decision | Independent | Money Manager | Supporter | |||
| Transfer to other in household | Transfer to outside household | Transfer to other in household | Transfer to outside household | Transfer to other in household | Transfer to outside household | |
| Respondent | 55% | 40% | 50% | 36% | 25% | 60% |
| Spouse | 17% | 5% | 22% | 2% | 20% | 2% |
| Respondent and Spouse | 9% | 6% | 12% | 5% | 22% | 6% |
| Other | 15% | 43% | 9% | 54% | 23% | 27% |
| Respondent and other | 4% | 7% | 5% | 3% | 9% | 5% |
| Spouse and other | 1% | 0% | 1% | 0 | 0% | 0% |
| Grand Total | 101% | 101% | 99% | 100% | 99% | 100% |
The data used for the analysis presented here come from interviews conducted over the phone throughout 2020 and 2021 with a sub-sample of 703 women workers and a sub-sample of 235 male workers. These workers are employed in factories spread across the five main industrial areas of Bangladesh (Chittagong, Dhaka City, Gazipur, Narayanganj, and Savar).