Reports
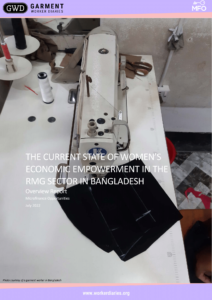
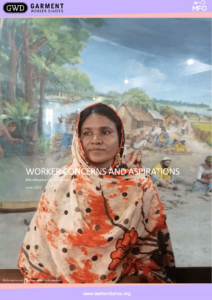
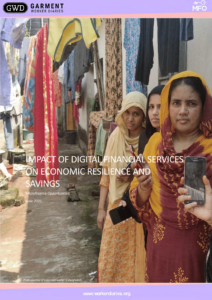
Latest Reports
Read in-depth analysis
Reports provide in-depth analysis of data collected directly from workers.
Review graphs for quick understanding of a topic
Scroll through selected topic or see all graphs and topics
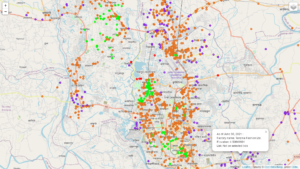
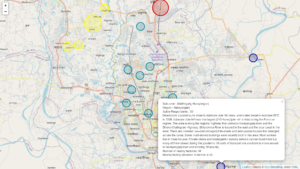
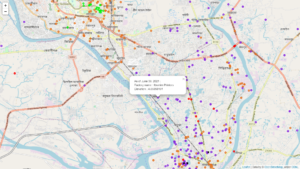
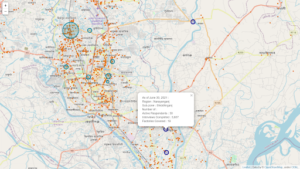
Review neighborhood and factory statistics
Learn about workers’ neighborhoods and the factories where they work
Read past in-depth reports
GWD continuously engages with workers. Read past reports to get an understanding of how their lives have changed (or not).
