Banner photo courtesy of a garment worker in Bangladesh
Last month we started a series of blogs on excess work hours. As we noted in that blog, articles published by local news sites in Bangladesh (Textile Today, Apparel Resources) reported that a Ministry of Labour and Employment circular, issued on April 13th, permits garment exporting factories to have their employees work two more additional hours of overtime per day, for a possible legal total of four hours of overtime. The new overtime rule went into effect on April 17th and is set to remain in place for six months. This means that it is now legal for a factory to have its workers work 12 hours a day, 6 days a week, for a total of 72 hours per week. Before this circular was issued, the legal limit was 10 hours a day, for a total 60 hours a week. The data we reported in that first blog, suggested that more than half the workers in the RMG sector in Bangladesh had worked excess hours in the first quarter of 2022.
In this week’s blog we dig deeper into the data to look for any regional differences in the share of workers working excess hours in the first quarter of this year and for any differences across factories—focusing on whether the factories appear on any public list as a supplier to an international brand and/or a member of any export-oriented association such as the Accord on Fire and Building Safety in Bangladesh (as of May 2021). The data suggest that there are regional differences in the share of workers working excess hours, and some interesting patterns of excess hours activity across factories, depending on their status.
Regional Differences
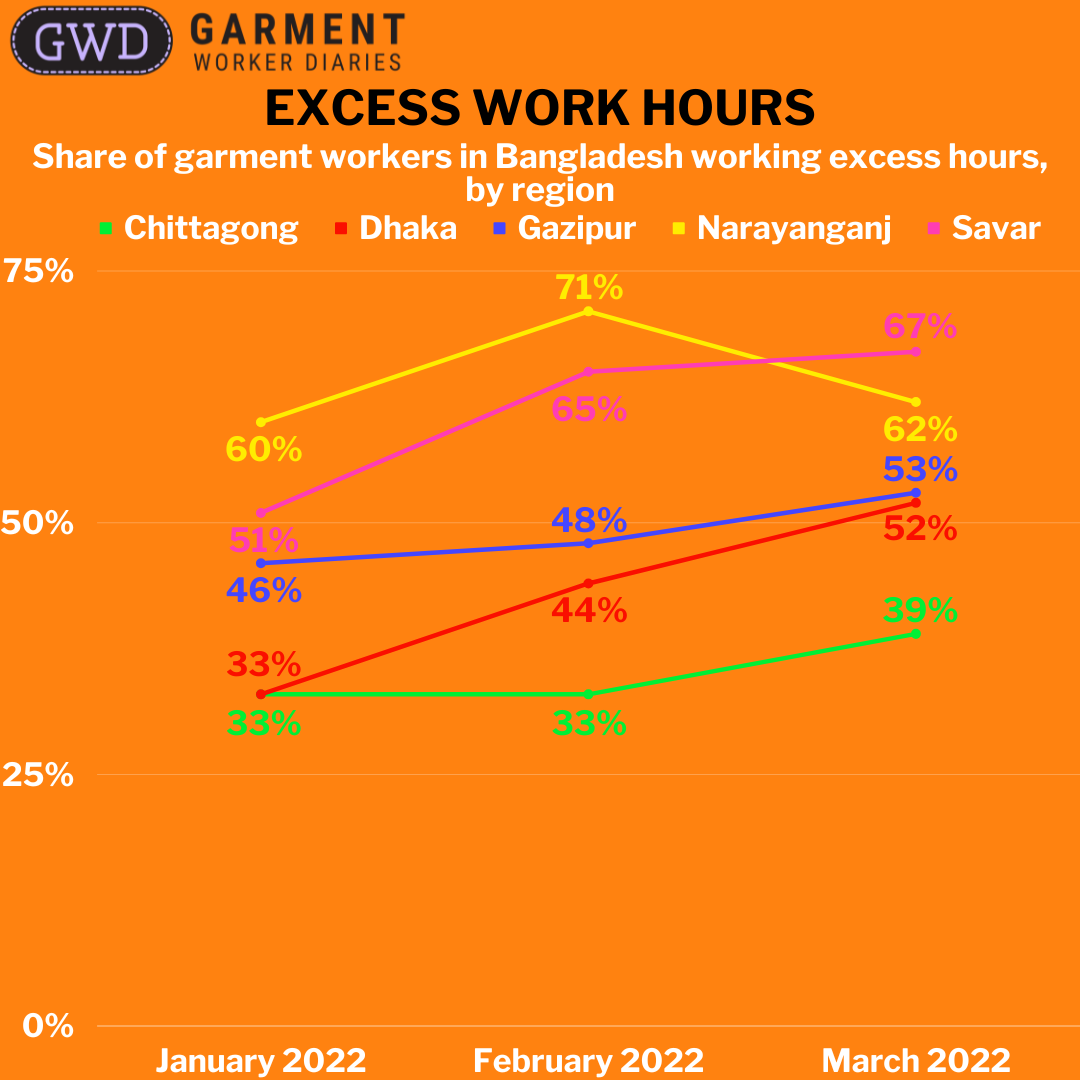
The data suggest that there is regional variation in the share of workers working excess hours. Across all three months of the first quarter of 2022 about 35% of workers in Chittagong worked excess hours, in comparison to 43% of workers in Dhaka City, 49% in Gazipur, and over 60% in both Narayanganj and Savar. When workers did work excess hours in Chittagong, the median number of hours was similar to those in Dhaka and Gazipur—about 305 hours per month. But in Narayanganj and Savar the typical worker working excess hours worked far more hours—321 and 317 hours respectively in those two regions.
All regions experienced an increase in the share of workers working excess hours from January to March, with Dhaka City and Savar experiencing dramatic increases of 18 and 16 percentage points respectively, while Chittagong and Gazipur experienced increases of 6 and 7 percentage points, and Narayanganj experienced a large increase from January to February but dropped back to January levels in March. In March, only Chittagong had fewer than half the workers in the region working excess hours.
By Region
| Month | Variable | Chittagong | Dhaka | Gazipur | Narayanganj | Savar | |||||
| Excess Work Hours | Normal Work Hours | Excess Work Hours | Normal Work Hours | Excess Work Hours | Normal Work Hours | Excess Work Hours | Normal Work Hours | Excess Work Hours | Normal Work Hours | ||
| January 2022 | Share of Respondents | 33% | 67% | 33% | 67% | 46% | 54% | 60% | 40% | 51% | 49% |
| Median Total Work Hours | 315 | 252 | 318 | 267 | 324 | 269 | 342 | 253 | 338 | 252 | |
| February 2022 | Share of Respondents | 33% | 67% | 44% | 56% | 48% | 52% | 71% | 29% | 65% | 35% |
| Median Total Work Hours | 274 | 215 | 271 | 222 | 284 | 224 | 294 | 216 | 283 | 224 | |
| March 2022 | Share of Respondents | 39% | 61% | 52% | 48% | 53% | 47% | 62% | 38% | 67% | 33% |
| Median Total Work Hours | 307 | 238 | 306 | 244 | 308 | 246 | 339 | 243 | 323 | 250 | |
| Grand Total | Share of Respondents | 35% | 65% | 43% | 57% | 49% | 51% | 64% | 36% | 61% | 39% |
| Median Total Work Hours | 305 | 235 | 303 | 245 | 308 | 243 | 321 | 243 | 317 | 250 | |
By Factory Status
As we have described in previous blogs (including this one), the Garment Worker Diaries uses factory lists curated by the Open Apparel Registry (OAR) and Mapped in Bangladesh (MiB) to organize our data by factory. This is an on-going challenge, as factory names are often very similar, which can lead to the mis-assignment of workers to factories. Workers also move from factory to factory, meaning that any analysis of the data we do by factory has to be broken down by month so we can assign the worker to the factory where they worked each month.
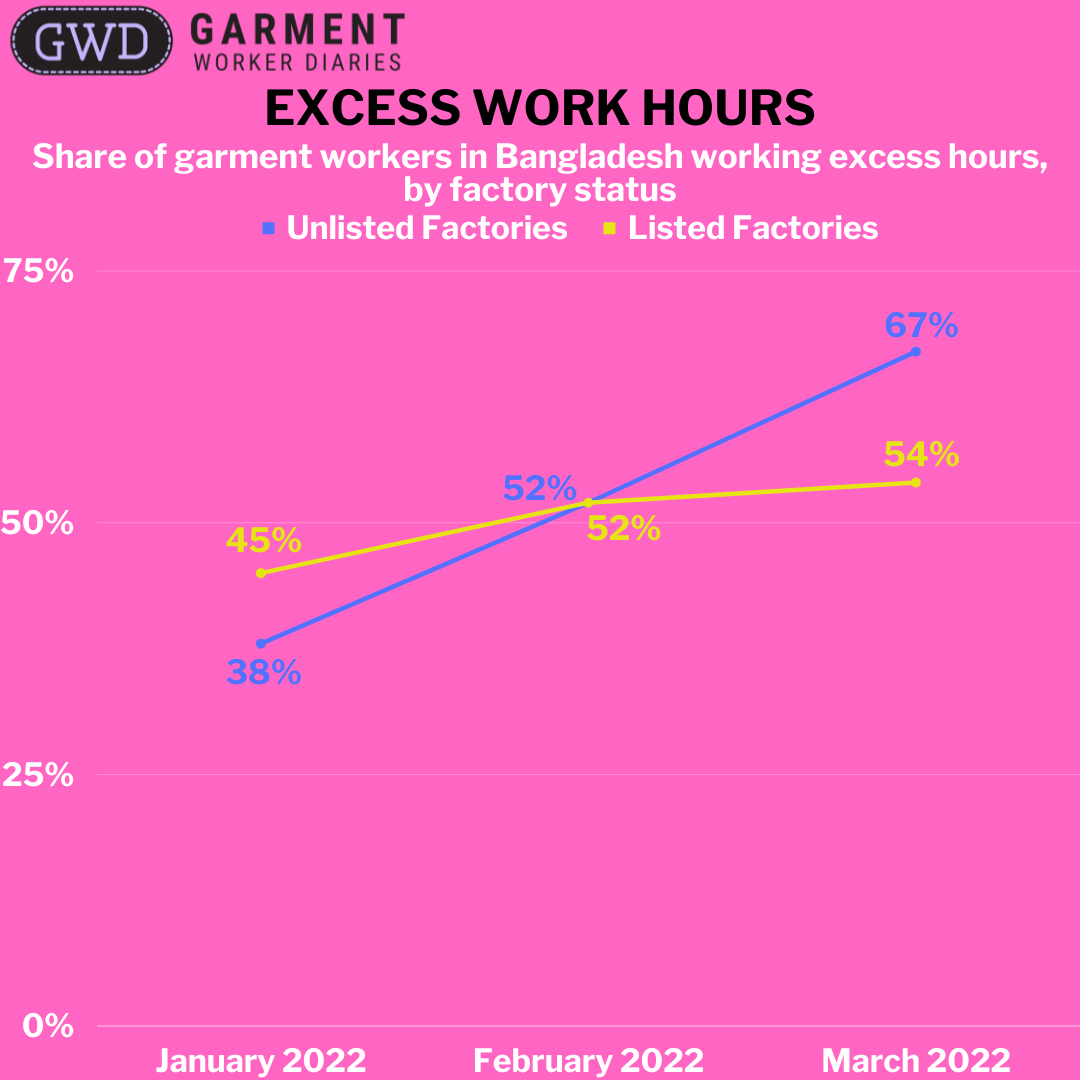
With these challenges in mind, we looked at whether there was any pattern in the distribution of excess hours worked across different types of factories. To keep things simple, we just looked at whether a worker worked in a factory appearing on either the MiB or OAR lists or not. Most of the workers in our sample work in factories on one of the two lists, about 90% of them. As might be expected, given the large share of the sample these workers represent, the share of workers in factories on one of these two lists who worked excess hours is similar to what we reported in the first blog in this series—under 50% in January, but over 50% in February and March. This means that we can be very certain that factories supplying international brands were having their workers work excess hours in the first quarter of this year. Furthermore, we can be very certain that the share of workers working excess hours in these factories is increasing.
One intriguing finding from this analysis is that workers in factories not on one of the lists were less likely to have worked excess hours in January, caught up with their counterparts on the list in February, and then worked far more hours in March. We are not sure, but this may be a case of orders trickling down from the large, export-oriented factories to the smaller factories as the former reach their capacity limits. We will continue to track the data this way so we can say more about this phenomenon.
January 2022
| Factory Status | Variable | Excess Work Hours | Normal Work Hours | Grand Total |
| Unlisted | Share of Respondents | 38% | 62% | 100% |
| Median Total Work Hours | 314 | 276 | 293 | |
| Listed | Share of Respondents | 45% | 55% | 100% |
| Median Total Work Hours | 328 | 263 | 294 |
February 2022
| Factory Status | Variable | Excess Work Hours | Normal Work Hours | Grand Total |
| Unlisted | Share of Respondents | 52% | 48% | 100% |
| Median Total Work Hours | 276 | 235 | 254 | |
| Listed | Share of Respondents | 52% | 48% | 100% |
| Median Total Work Hours | 283 | 222 | 257 |
March 2022
| Factory Status | Variable | Excess Work Hours | Normal Work Hours | Grand Total |
| Unlisted | Share of Respondents | 67% | 33% | 100% |
| Median Total Work Hours | 304 | 250 | 301 | |
| Listed | Share of Respondents | 54% | 46% | 100% |
| Median Total Work Hours | 315 | 246 | 283 |
The data are drawn from interviews with about 1,300 workers interviewed weekly from January 2022 to March 2022. The number of worker responses in a particular month varies depending on interview participation rates throughout the month but were never below 1,210 during this period. These workers are employed in factories spread across the five main industrial areas of Bangladesh (Chittagong, Dhaka City, Gazipur, Narayanganj, and Savar). Just over three-quarters of the working respondents are women, roughly representative of workers in the sector as a whole.