MFO and SANEM have been collecting data from garment workers in Bangladesh consistently for over three years, allowing us to home in on specific respondent metrics and identify trends or changes over long lengths of time. As some of the workers in our study have been with us for all three years at this point, we can compare veteran respondents with those who are newer to the project.
For this blog, now that Eid al-Adha has concluded for the year and the relevant data has been analyzed, we’d like to discuss data relevant to Eid from 2019 to 2021. We wrote a similar blog back in June 2020 which analyzed Eid al-Fatir data only. We’ll be discussing both Eid cycles in this blog and touching on similar themes as the previous blog, namely bonus payments, digital vs. cash payments, and excess work hours in the run-up to both Eids. We analyzed the data for two different, but overlapping, groups: first, only workers who had been in our study for all three Eid cycles; second, all workers who were in the study at the time of each Eid cycle. We did this so we could check to see whether turnover in who is participating in the project is driving any trends we see over time. Our analysis shows little difference in the results across the two groups, so the data we will present here will be for the second group: all workers who were in the study at the time of each Eid cycle.
Note: Banner photo courtesy of a garment worker in Bangladesh; numbers in graphs and lists may not sum to 100% due to rounding.
Eid Bonus Payments
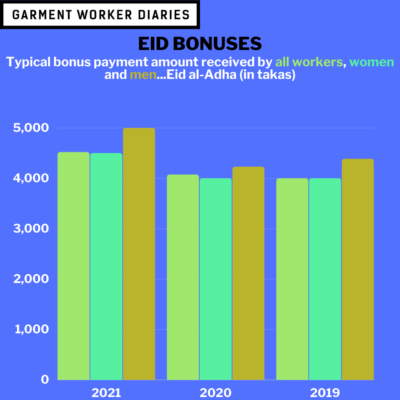
As we’ve discussed before, Eid bonus payments from factories are considerable sums of money, relative to what the typical garment worker earns in a month. The typical bonus amount received over the past three years’ Eid cycles has varied from about Tk. 4,000 to about Tk. 4,500 (with men almost always receiving somewhat more than women). This could represent anywhere from about 40% of a typical worker’s monthly earnings to just under 50%, depending on the month.
Across the previous three years’ Eid cycles, garment workers have earned steadily higher bonus amounts, as depicted in the table below:
|
Eid Bonus Payments, median amounts (in takas) |
2021 All Respondents |
2020 All Respondents |
2019 All Respondents |
||||||
|
All |
Female |
Male |
All |
Female |
Male |
All |
Female |
Male |
|
|
Eid al-Fatir |
4,500 |
4,500 |
5,000 |
4,200 |
4,000 |
4,360 |
4,000 |
4,000 |
4,335 |
|
Eid al-Adha |
4,520 |
4,500 |
5,000 |
4,074 |
4,000 |
4,230 |
4,000 |
4,000 |
4,385 |
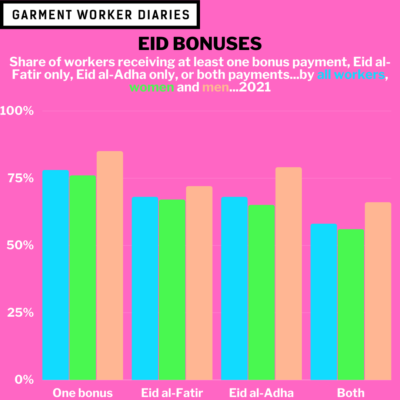
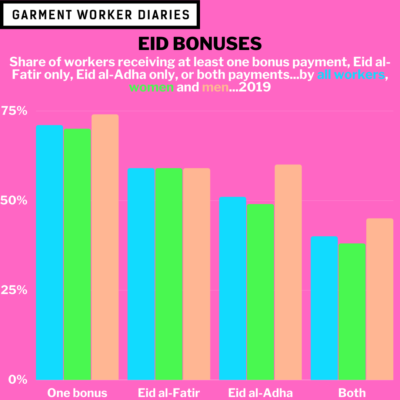
Not every worker receives an Eid bonus every year, but a sizeable majority of workers do receive at least one bonus payment, with many workers receiving both bonuses. In a typical year, between 71% and 81% of all workers receive at least one Eid bonus payment. Again, men are somewhat more likely to receive a bonus payment than women, in 2020 and 2021 by as much as nine percentage points more likely, as shown below:
|
Eid Bonus Payments, share receiving |
2021 All Respondents |
2020 All Respondents |
2019 All Respondents |
||||||
|
All |
Female |
Male |
All |
Female |
Male |
All |
Female |
Male |
|
|
At least one bonus |
78% |
76% |
85% |
81% |
79% |
88% |
71% |
70% |
74% |
|
Eid al-Fatir |
68% |
67% |
72% |
64% |
62% |
71% |
59% |
59% |
59% |
|
Eid al-Adha |
68% |
65% |
79% |
72% |
70% |
79% |
51% |
49% |
60% |
|
Both |
58% |
56% |
66% |
55% |
53% |
61% |
40% |
38% |
45% |
When looking at respondents who were fortunate enough to receive both Eid bonus payments, that share has ranged from 40% to 58% over the past three Eid cycles.
Digital vs. Cash Payments
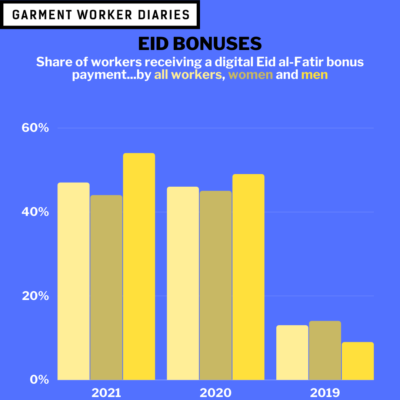
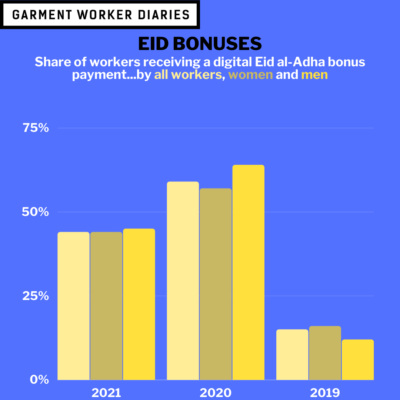
The story here is a continuation of the story as we told it in June 2020: many more respondents in 2020 and 2021 received either Eid bonus payment digitally compared to how they received either bonus payment in 2019. However, the rate of digital payments seems to have stabilized or slightly tapered off when comparing 2021 to 2020, as the prevalence of cash payments has ticked back up slightly or refused to budge.
Regarding the share of women and men who receive a digital Eid bonus, there is no great difference between the two groups. However, women were slightly more likely than men to receive a digital bonus in 2019, and in 2020 and 2021 men appear slightly more likely than women to receive one.
|
Eid Bonus Payments, share receiving digital payments |
2021 All Respondents |
2020 All Respondents |
2019 All Respondents |
||||||
|
All |
Female |
Male |
All |
Female |
Male |
All |
Female |
Male |
|
|
Eid al-Fatir |
47% |
44% |
54% |
46% |
45% |
49% |
13% |
14% |
9% |
|
Eid al-Adha |
44% |
44% |
45% |
59% |
57% |
64% |
15% |
16% |
12% |
Excess Work Hours
In the week before Eid, it is not uncommon for workers to put in additional hours at the factory. The Bangladesh Labour Act, 2006 (see page 60) states that 60 hours (including overtime and not counting break time) in a work week is the legal limit. Any time worked above that is deemed excessive.
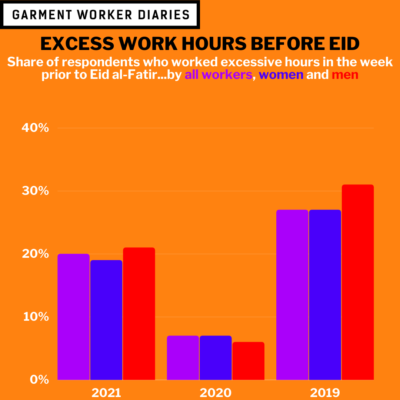
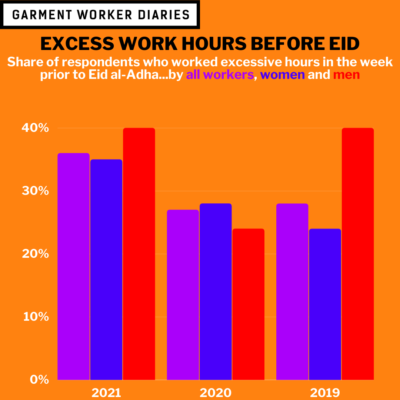
Over the past three Eid cycles, the share of respondents who worked an excessive number of hours in the run-up to Eid has dropped a little for Eid al-Fitr, but risen a little for Eid al-Adha. For the week preceding Eid al-Fitr in 2020 the share of respondents who worked an excessive amount of hours is unusually low, and this can likely be explained by that week coming at the very beginning of the COVID-19 pandemic, when the industry was still swamped with uncertainty.
One other trend to note, as shown in the table below, is that the share of respondents who told us they did not work at all in the week preceding either Eid has slightly increased.
|
Run-up to Eid, share working excess hours |
2021 All Respondents |
2020 All Respondents |
2019 All Respondents |
||||||
|
All |
Female |
Male |
All |
Female |
Male |
All |
Female |
Male |
|
|
Eid al-Fatir |
|||||||||
|
Excess Work Hours |
20% |
19% |
21% |
7% |
7% |
6% |
27% |
27% |
31% |
|
Normal Work Hours |
66% |
65% |
69% |
75% |
73% |
80% |
70% |
70% |
69% |
|
No Work |
14% |
16% |
10% |
18% |
20% |
14% |
3% |
3% |
1% |
|
Eid al-Adha |
|||||||||
|
Excess Work Hours |
36% |
35% |
40% |
27% |
28% |
24% |
28% |
24% |
40% |
|
Normal Work Hours |
49% |
49% |
50% |
60% |
57% |
69% |
69% |
72% |
59% |
|
No Work |
15% |
16% |
9% |
13% |
15% |
7% |
3% |
3% |
0% |
The data used for the analysis presented here come from interviews conducted in person with a pool of 1,230 workers in 2019, and from interviews conducted over the phone in 2020 and 2021 with a pool of 1,268 and 1,289 workers, respectively. These workers are employed in factories spread across the five main industrial areas of Bangladesh (Chittagong, Dhaka City, Gazipur, Narayanganj, and Savar). Just over three-quarters of the working respondents are women, roughly representative of workers in the sector as a whole.


