Recently we wrote a blog post about the potential flood risk to garment factories in Bangladesh based on the factories’ elevations above sea level. Using two lists of factories in Bangladesh (one compiled by the Open Apparel Registry (OAR) and another compiled by Mapped in Bangladesh (MiB)) what we found is that about 80% of factories there are situated five meters or more above sea level, but that the rest of the factories, about 20%, have been built on land which is currently five meters or less above sea level. In about ten years’ time, those 20% of low-lying factories could be subjected to regular flooding due to sea level rise and other climactic changes.
After making this discovery, we wanted to see if there was any correlation between a factory’s elevation and its presence on certain selected factory lists. We began again with a master list of factories, this time comprised of the 5,362 unique factory names found on OAR’s master list (we did not use the MiB list for this analysis). We selected four lists of factories, two of which were compiled by external sources, and two of which were curated internally by us as taken from the OAR master list:
- Agreement on Sustainable Garments and Textile (AGT): as described by the OAR, the AGT is “a Dutch multi-stakeholder Initiative on international responsible business conduct in the garment and textile sector”. Industry stakeholders can participate in the AGT by getting in touch directly with specific representatives listed on the AGT’s website.
- Accord on Fire and Building Safety in Bangladesh: as described on its own website, the Accord is “an independent, legally binding agreement between brands and trade unions to work towards a safe and healthy garment and textile industry in Bangladesh. The Accord covers factories producing Ready-Made Garments (RMG) and at the option of signatory companies, home textiles and fabric & knit accessories.” Both brands who source from factories and factories themselves can voluntarily enroll to participate in the program on the Accord’s website.
- Factories which have had their names contributed to OAR’s list by a brand: MFO manually identified each unique brand that had contributed at least one supplier factory name to the OAR master list. We found 113 such unique brand names contributing to the OAR master list.
- Factories which have had their names contributed to OAR’s list by a brand sourcing from more than 20 factories in Bangladesh: Among those 113 unique brands in the above list, we found 51 brands who, in addition to contributing at least one supplier factory name to OAR’s master list, were also sourcing from more than 20 factories in Bangladesh.
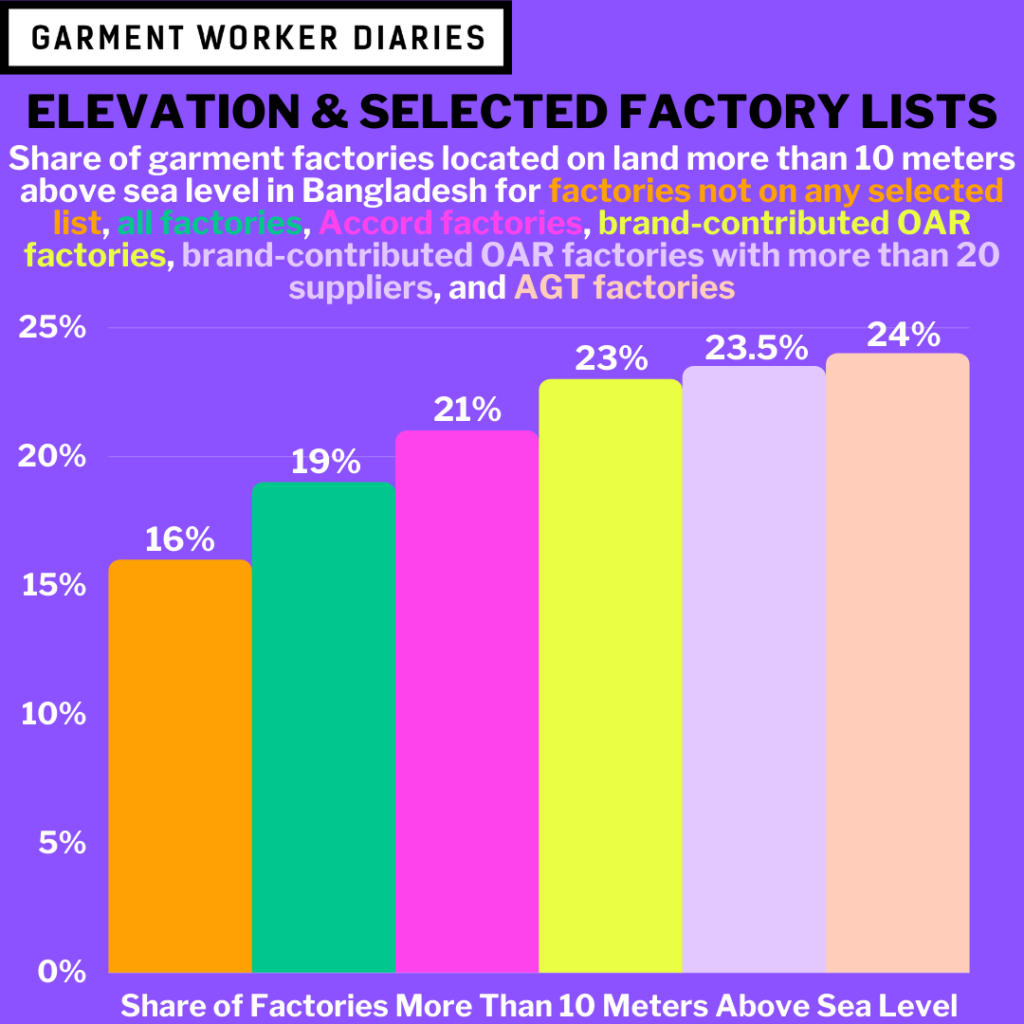
We looked at each factory’s elevation and assigned it to an elevation range: more than ten meters above sea level; five to ten; three to five; up to three meters; and at sea level or below. We then compared the factories on each of the four lists against the remainder of the factories not on the list. What we found is worth sharing here.

Note: Banner photo courtesy of a garment worker in Bangladesh; numbers in graphs may not sum to 100% due to rounding.
Across all of the four selected factory lists described above, a greater (and statistically significant) share of the factories on each list was situated at elevations more than ten meters above sea level, in comparison to factories not on the selected factory list we were looking at. And among three of the four lists (all but the AGT), a lesser (and statistically significant) share of the factories was found to be situated within lower elevation ranges (a lesser share of factories fell within the five to ten meter range for Accord factories, and a lesser share of factories fell within the three to five meter range for the two curated OAR lists comprised of brand-submitted factory names). In other words, factories on each of the four lists are less likely to be flood-prone than factories not on the list. Furthermore, when we compare factories on the list with factories that do not appear on any of the lists, the difference is even more pronounced.
We have some theories as to why these correlations exist. First, more desirable and/or manageable land tends to get developed first. Factories that have been established longer (and thus might be more apt to appear on one of our four lists) thus tend to find themselves on higher ground, away from flood-prone low-lying areas and/or areas too close to rivers. Second, land that is less desirable (again, in our context that land which is lower and thus more flood-prone) is cheaper than land that is more desirable (higher up and less flood-prone). Factories that have the official, “selected” backing of industry stakeholders such as large multinational brands (which thus cause these factories to appear on one of our four lists) might be better able to afford the pricier land higher up away from the flood danger.
In the map below, factories from all five categories (the four lists and factories not appearing on any list) are represented by dots, and you can hover over the stacked layer icon in the upper-right hand corner of the map to hide or reveal any of the five categories. Each factory is also color-coded to notate its elevation range: green factories are located more than ten meters above sea level; orange factories are between five and ten meters; purple at three to five; red up to three meters; and yellow factories are at or below sea level. Each dot can also be clicked to produce a pop-up, providing more information about that particular factory.
