In last week’s blog MFO’s data analyst, Carol Karimi, provided an update on the distribution of our sample of workers, which is concentrated in five regions of the country, where about 70 percent of the workers in the RMG sector in Bangladesh live and work. This week, with COP26 in mind, we revisit the map showing the distribution of the sample and of the factories, but this time show the elevation of the factories above sea level as a way to assess the risks climate change pose for the RMG sector in Bangladesh.
Bangladesh faces three different flooding threats: rising sea levels, increased river flooding as glaciers melt in the Himalayas, and the increased frequency of intense rainfall (although not necessarily more rainfall). This has been apparent for many years:
Most of Bangladesh lies in the delta of three of the largest rivers in the world―the Brahmaputra, the Ganges, and the Meghna [MOEF]. The topography of the country is mostly low and flat. Two-thirds of the country is less than 5 meters above sea level and is susceptible to river and rainwater flooding. As a result, approximately one-quarter of the country is inundated in an “average” year. (USAID, Climate Change Information Fact Sheet 2015)
The data suggest that things are only getting worse with respect to sea level rise, according to a recent study by a consortium of researchers from Bangladesh and Europe. In an interview with The Business Standard in Bangladesh, Prof AKM Saiful Islam of Professor of Institute of Water and Flood Management, Bangladesh University of Engineering and Technology (BUET) stated:
According to the global prediction of Intergovernmental Panel on Climate Change (IPCC), the sea level rise would be 1m within 2100 century for climate change. But it’s the average prediction… Bangladesh and parts of India could be hit by sea-level rise almost twice as high as previously thought due to land subsiding.
To assess the vulnerability of the RMG sector to climate change, we used two data sets. One is the list of factories extracted from lists compiled by Mapped in Bangladesh and Open Apparel Registry that we described last week. The second is a data set provided by Climate Central, which uses an innovative technique to accurately measure land elevations above sea-level. Their analysis shows that many measurement systems used in the past have over-estimated land elevations and they provide evidence that their model has much greater accuracy when tested against highly accurate satellite data for the U.S. and Australia.
What we found is that 80% of exporting factories in the RMG sector are located on land 5 metres or more above sea level—land at this elevation is less prone to flooding than land in Bangladesh in general. But it also means that 20% of factories are below that 5 metre mark, putting them in danger of regular flooding by 2030 and beyond.
| Elevation | Number of Factories | Share of Factories | Color on Map |
| At sea level or below | 5 | 0.1% | Yellow |
| Up to 3 metres above sea level | 56 | 1.0% | Red |
| 3 to 5 metres above sea level | 1,094 | 19.7% | Purple |
| 5 to 10 metres above sea level | 3,341 | 60.1% | Orange |
| More than 10 metres above sea level | 1,063 | 19.1% | Green |
| Total | 5,559 | 100.0% |
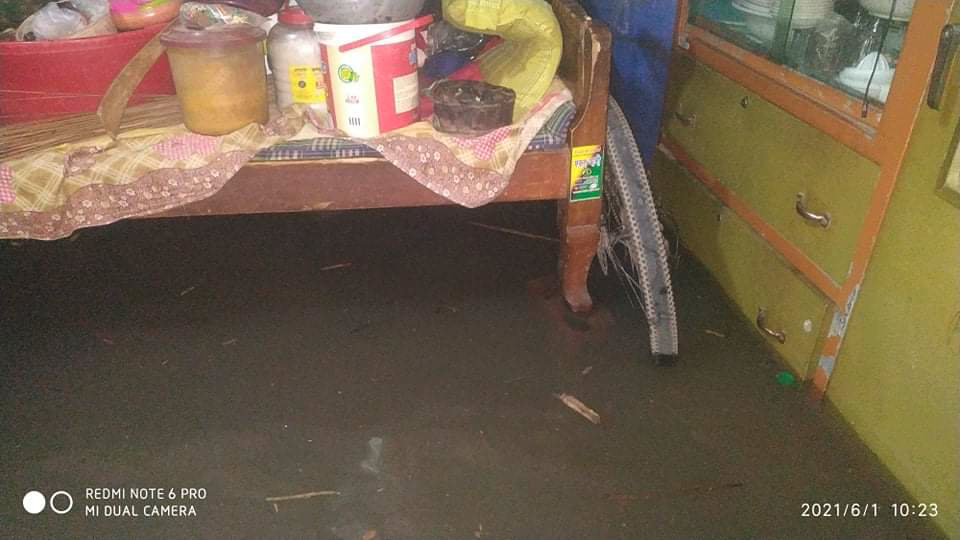
Flooding of factories does not just put considerable capital investments at risk, it also puts the livelihoods and lives of workers employed in the factories at risk. If factories flood, then workers cannot work, and our weekly interviews with workers suggest that they do not have a large financial cushion to fall back—they do save but those savings do not last very long. Furthermore, if factories flood it is likely that workers’ homes will flood as well because workers live close to where they work—so the data on factory elevations is indicative of how vulnerable garment workers are to floods. In fact, it is likely that workers’ homes are more vulnerable. As one worker we spoke to about this said: “As our houses are near the river, there is always the fear that someday the storm will end it all.”
The map below visualizes the threat factories and workers are facing, not in the usual manner of showing locations against potential flooding scenarios, but simply by color-coding the factories according to their elevations using the color scheme in the table above. If you zoom out you can see the pattern of land elevations defined by the colors of the factories—in the center of the map you will see Dhaka, but don’t forget to pan over to Chattogram/Chittagong. And if you zoom in you can see the names and elevations of individual factories. You will notice that there are black circles on the map. These are not factories, but are the rough locations of workers who we talked to about climate change (but not their exact locations to preserve anonymity). If you click on a black circle you can see what they had to say in answer to the following questions:
Are you concerned about climate change? (enumerators to only ask this to 2 workers each)
Why? Why not?
Have weather or nature-related disasters affected you and your family? (enumerators to only ask this to 2 workers each)
How?
Are you concerned that weather or nature-related disasters could affect you in the future?
Why? Why not?
Note: Banner photo courtesy of a garment worker in Bangladesh.