Our Garment Worker Diaries review this week marks a full year of resumed data collection in Bangladesh during the COVID-19 pandemic. Some of the data have been bleak: in April 2020, only 49% of garment workers went to work, and in May the median salary payment they received (for April hours worked) was Tk. 5,522, far below the April 2019 median salary payment of Tk. 9,500. But many of data have not been bleak: by May, 84% of garment workers were back at work and their June salaries (payment for May) was Tk. 9,410 (back to normal).
Data-driven stories can be incredibly persuasive, but these types of stories are never finished, and as we have experienced during the pandemic, data can be in flux from month to month. This is why we recognize the importance of uninterrupted data collection with garment workers, especially right now. News reports from Bangladesh are again turning stark, as the country has just reported its highest single-day death toll from COVID-19. A partial lockdown escalated into total lockdown this week with “movement passes” required to venture outside the home. Preceeding the lockdown, there have been reports of vaccine shortages, as the country copes with reliance on its sole vaccine option, AstraZeneca.
Amid all of this, garment-producing factories will remain open, and presumably, garment workers will be expected to get themselves to work despite public transport having been basically stopped or severely limited. We should note, however, that we have anecdotal evidence from the field that at least some factories are pitching in to assist with their workers’ commutes.
So, while employment and earnings numbers have basically returned to normal for garment workers, and while we haven’t yet seen an uptick in illness numbers among our respondent pool, the situation could change, and change quickly. So let’s sum up where we are at through the end of March 2021, and hope for the best.
Employment
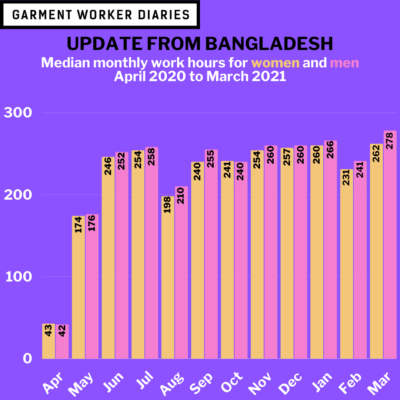
In March 2021 the rate of employment for garment workers in Bangladesh was 87% (86% for women and 91% for men). That’s basically the same rate as the preceding two months’ employment rate of 86%. Median work hours, meanwhile, were off the charts (at least for this study) at 270 median hours, the highest recorded yet in the past 12 months (and the highest for both women and men, at 262 and 278, respectively). A partial explanation could be that March had 27 working days, which is slightly higher than average.
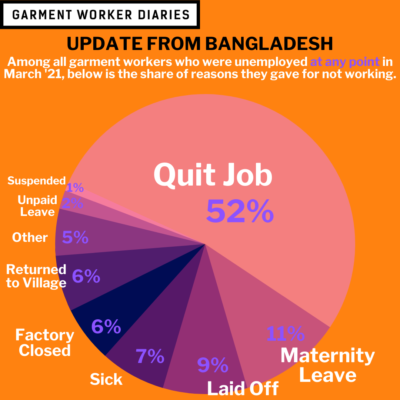
Also in March: 52% of respondents who were unemployed at least once during the month listed “Quit” as their reason for not working, the highest proportion in the past 12 months. Other reasons for unemployment were given in similar proportions to prior months. And again, there were no respondents who listed “home quarantining” as a reason for not working, the sixth such month in a row.
Salary Payments
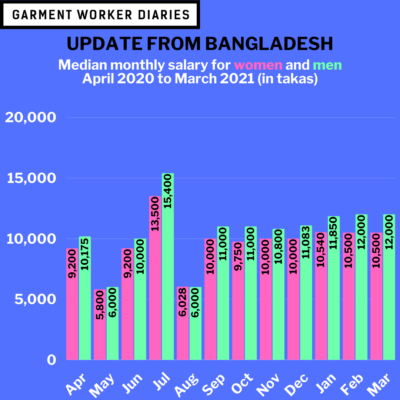
82% of garment workers received a salary in March, the same rate as in February and only a bit less than the 86% who got paid in January. The median salary received was Tk. 11,000 for all workers, and Tk. 10,500 for women and Tk. 12,000 for men (identical to the median salary amounts in February).
In February, the median hours worked for women was 231, and for men the median hours worked was 241. Looking at workers’ March salary payments (for February hours worked) this gives women a pay rate of about Tk. 45 per hour and men a pay rate of about Tk. 50 per hour.
Digital Payments and Financial Transactions
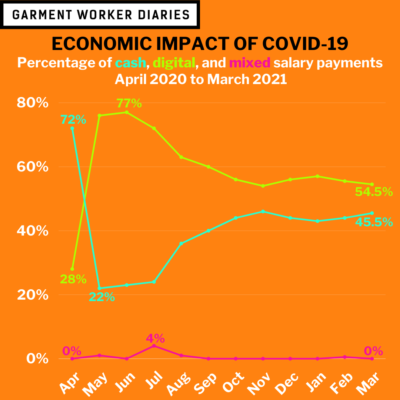
Digital salary payments as a proportion of total salary payments slid just a bit from our last reporting in January 2021, from 57% of all salary payments then to 55% in February and about 54.5% in March. Cash salary payments accounted for about 45.5% of all salary payments, with only two respondents receiving a mixed salary payout (a near zero percentage).
The proportion of other financial transactions in March were reported at about the same rates as all other months. Cash is still by far the primary method for almost all transactions, with only money transfers sent outside the household being predominantly digital.
Food Security and Health
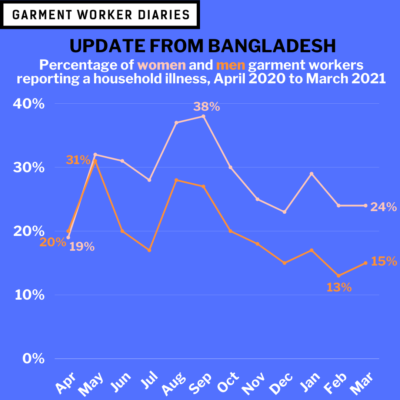
Household illness and injury levels held steady in February and March, and almost everyone who wanted to seek medical treatment did so (the prevailing reason for not seeking treatment is that it was “not necessary” in both months).
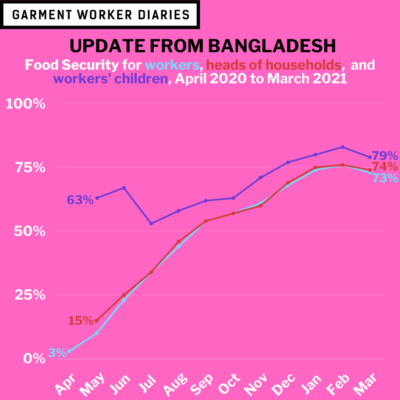
It looks like food security rates for respondents and heads of household have leveled off since December, at about 74%. In other words, even when salaries are back to normal and workers are putting in long hours about one in four workers reported not eating enough food because of a lack of money in at least one week in each month from December through to the end of March. The food security rates for children appear to be holding somewhat steady at around 79%—meaning that despite all their parents’ hard work about one in six children did not eat enough in at least one week in each month during this same period. We have no current explanation as to why this could be, but hopefully it is a data fluctuation which will reverse itself next month.
The data are drawn from interviews with about 1,300 workers interviewed weekly from April 2020 to March 2021. The number of worker responses in a particular month vary depending on interview participation rates throughout the month, but were never below 1,206 during this period. These workers are employed in factories spread across the five main industrial areas of Bangladesh (Chittagong, Dhaka City, Gazipur, Narayanganj, and Savar). Just over three-quarters of the working respondents are women, roughly representative of workers in the sector as a whole.
Editor’s Note: Since publication of this blog post, we have revised some data and associated infographics:
- Previously we stated that our definition of unemployed workers only included workers who were unemployed for the entire month. This was incorrect. In our analysis we defined any worker who was unemployed at least once during the month as unemployed. This was the denominator used to calculate the share of responses unemployed workers gave for not working, which is what the numbers in the text and graphics reflect.
- As originally published the food security data was slightly understating the share of respondents who were reporting that their children were food secure. This means that slightly more children were actually food insecure than our original data analysis suggested. We have updated the numbers both in the body of the blog and in the infographic to more accurately represent the food security data.

